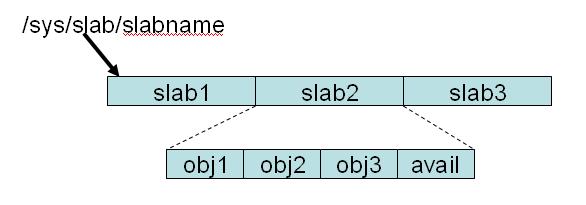

As you can see, for a given slab name there are multiple slabs and each slab consists of multiple objects. When a process requests an allocation of slab memory it is provided as an object from a slab if there is one available. If there are none, a new slab is allocated and the object provided from it. Furthermore, slub allows slabs of different names but whose objects are the same sizes to share the same slab as you can see below for the slab with the very ugly name of :0001024, which in this case is a slab which contains 1K objects. These additional entries are called aliases for obvious reasons:
drwxr-xr-x  2 root root 0 Dec 27 07:48 /sys/slab/:0001024
lrwxrwxrwx  1 root root 0 Dec 27 07:48 /sys/slab/biovec-64 -> ../slab/:0001024
lrwxrwxrwx  1 root root 0 Dec 27 07:48 /sys/slab/kmalloc-1024 -> ../slab/:0001024
lrwxrwxrwx  1 root root 0 Dec 27 07:48 /sys/slab/sgpool-32 -> ../slab/:0001024
Good news! The slab memory field reported in /proc/meminfo finally matches the total memory reported the individual slabs and so the need for collectl's slab summary usage for all slabs has been reduced. However, when selecting a subset of slabs by filter(s), the summary will show the totals for the selected slabs and will therefore be more useful. More on this in the examples below.
The main pieces of information collectl reports on for each named slab are the number of slabs that have been allocated, the corresponding number of objects and the number of objects that have actully been allocated to processes. Collectl reports the total memory associated with the slabs as well as the amount of slab memory actually being used by processes. It also reports some constants such as the number of objects/slab and the physical sizes of both objects and slabs.
The following examples show several different output formats and the commands used to produce them. One should note there is similar output for the old style slab data but. It should also be noted that an interval of 1 second has been chosen in each case and one should always consult the help and/or man pages for more detail as there are many other formatting options. Perhaps the easiest way to get started it to just type the command collectl -i:1 -sY and later add some additional switches to see their impact. For those new to collectl, you should also realize that collectl can run as a daemon logging all this in the background for later playback and that all the different subsystems it supports can be include by simply adding them to -sY.
collectl -i:1 -sy --slabfilt blk,ext --verbose -oT
# SLAB SUMMARY
#         <---Objects---><-Slabs-><-----memory----->
#          In Use   Avail  Number      Used   TotalK
13:21:10   120625  124233   30701   113894K  122832K
13:21:11   120625  124233   30701   113894K  122832K
13:21:12   120625  124233   30701   113894K  122832K
collectl -i:1 -sY --slabfilt blk,ext -oTm
waiting for 1 second sample...# SLAB DETAIL
#                                          <----------- objects --------><--- slabs ---><---------allocated memory-------->
#             Slab Name                    Size  /slab   In Use    Avail  SizeK  Number     UsedK    TotalK   Change    Pct
09:30:56.004 blkdev_ioc                      64     64     1183     1472      4      23        73        92        0    0.0
09:30:56.004 blkdev_queue                  1608      5       29       30      8       6        45        48        0    0.0
09:30:56.004 blkdev_requests                288     14       32       56      4       4         9        16        0    0.0
09:30:56.004 ext2_inode_cache               928      4        0        0      4       0         0         0        0    0.0
09:30:56.004 ext3_inode_cache               976      4    36916    36916      4    9229     35185     36916        0    0.0
09:30:56.004 ext3_xattr                      88     46        0        0      4       0         0         0        0    0.0
collectl -i:1 -sY --slabfilt blk,ext,dentry --slabopts S -oT
# SLAB DETAIL
# SLAB DETAIL
#                                      <----------- objects --------><--- slabs ---><---------allocated memory-------->
#         Slab Name                    Size  /slab   In Use    Avail  SizeK  Number     UsedK    TotalK   Change    Pct
09:33:49 blkdev_ioc                      64     64     1193     1472      4      23        74        92        0    0.0
09:33:49 blkdev_queue                  1608      5       29       30      8       6        45        48        0    0.0
09:33:49 blkdev_requests                288     14       51       70      4       5        14        20        0    0.0
09:33:49 dentry                         224     18    42000    42048      4    2336      9187      9344        0    0.0
09:33:49 ext3_inode_cache               976      4    36916    36916      4    9229     35185     36916        0    0.0
09:33:51 blkdev_requests                288     14       40       70      4       5        11        20        0    0.0
09:33:51 dentry                         224     18    42006    42048      4    2336      9188      9344        0    0.0
09:34:00 dentry                         224     18    42000    42030      4    2335      9187      9340    -4096   -0.0
09:34:01 blkdev_ioc                      64     64     1191     1472      4      23        74        92        0    0.0
09:34:01 blkdev_requests                288     14       37       70      4       5        10        20        0    0.0
09:34:01 dentry                         224     18    42008    42030      4    2335      9189      9340        0    0.0
As with process data, the argument of the switch describes how to sort the data and an optional line count. In the case of slabs the sort name matches the column headers making them easy to identify and if you forget how to get started, just run collectl with --showtopopts. Naturally filtering can be applied as well and the following shows the output when used with a couple of filters.
collectl --top numobj --slabfilt nfs,tcp

# TOP SLABS 15:56:41
#NumObj  ActObj  ObjSize  NumSlab  Obj/Slab  TotSize  TotChg  TotPct  Name
    336     336       32        3       112      12K       0     0.0  tcp_bind_bucket
    330     330      128       11        30      44K       0     0.0  nfs_page
    270     144      128        6        30      36K       0     0.0  tcp_open_request
    130     130      384       13        10      52K       0     0.0  nfs_write_data
    130      68      384        8        10      52K       0     0.0  nfs_read_data
     60      60      128        2        30     8192       0     0.0  tcp_tw_bucket
anon_vma                  548864      548864      548864      548864         0      0.00
arp_cache                   4096        4096        4096        8192      4096    100.00
avc_node                    4096        4096        4096        4096         0      0.00
bdev_cache                 45056       45056       45056       45056         0      0.00
bio                        65536      114688       53248     1662976   1609728   3023.08
biovec-1                   24576       28672       12288      348160    335872   2733.33
biovec-128                  4096       12288        4096       24576     20480    500.00
biovec-16                  12288       24576        4096      102400     98304   2400.00
As with the process analysis report, you can control the timeframe of the report using --from/--thru and unless you explicitly specify one or more subsystems no other data will be reported. On the other hand if you do specify -s, you will get the additional data reported in the standard way in plot-formatted files.
If you have indeed chosen to use this mechansim there are a few things that have changed in collectl's behavior:
| updated June 7, 2009 |