With the release of Collectl Version 3.3.1, one can now send collectl data directly to a ganglia gmond in binary format using the custom export gexpr.ph. This results in several benefits for existing users of ganglia:
As of V3.5 of collectl, the experimental status of this capability has been lifted since enough people are currently using it to verify it works as described.
This configuration assumes one has set up ganglia gmonds in a hierarchy, such that those at the bottom of the tree collect system statistics and send them up to a higher level aggregation gmond and ultimately percolate up to the gmetad which writes the data to a round-robin database.

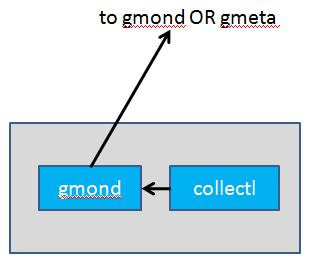
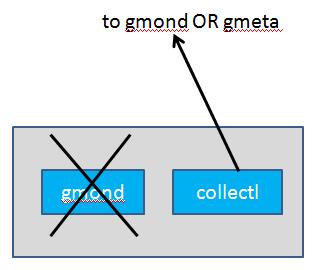
To use collectl as a data source there are 2 alternatives. In the diagram below at the left you simply have collectl send data to a local gmond to supplement whatever data it is already collecting, noting there won't be any way to record any of gmond's data locally. The diagram at the right would replace all gmonds and have collectl do all the data collection, optionall logging data locally, and sending data to an aggregation level gmond. Whatever method you chose you must ensure the gmond(s) are listening on their udp receive channel and enable the ganglia communications feature in collectl as described in the following sections. There are probably other hybrid configurations which are beyond the scope of this document as well as this author.
 |  |
One last component is configuring the rrd to use the metrics being supplied by collectl and the details of that discussion are beyond the scope of this document as well.
The following example shows collectl gathering data on many system components but only sending cpu, disk, memory and network data to a gmond on system gmond using port 8108. It also sends a set of data every 20 seconds while writing the data to a file in plot format to a local file in /tmp every 5 seconds.
This module also supports sending its output to a multicast address, which is used if hostname in an address in the range of 225.0.0.0 through 239.255.255.255. To use this feature you will have to first install IO::Socket::Multicast which in turn requires the module IO::Socket::Interface be installed as well. Note that both these modules may be updated and so you should verify you're actually installing the latest one.
collectl -scdfijmntx --export gexpr,gmond:8108,s=cdmn,i=20 -i5 -f /tmp -P
 collectl -scd --export gexpr,192.168.253.168:2222,d=1

 07:32:11.004 Name: cputotals.user       Units: percent               Val: 0
 07:32:11.004 Name: cputotals.nice       Units: percent               Val: 0
 07:32:11.004 Name: cputotals.sys        Units: percent               Val: 0
 07:32:11.004 Name: cputotals.wait       Units: percent               Val: 0
 07:32:11.004 Name: cputotals.irq        Units: percent               Val: 0
 07:32:11.004 Name: cputotals.soft       Units: percent               Val: 0
 07:32:11.004 Name: cputotals.steal      Units: percent               Val: 0
 07:32:11.004 Name: cputotals.idle       Units: percent               Val: 99
 07:32:11.004 Name: ctxint.ctx           Units: switches/sec          Val: 173
 07:32:11.004 Name: ctxint.int           Units: intrpts/sec           Val: 1031
 07:32:11.004 Name: ctxint.proc          Units: pcreates/sec          Val: 4
 07:32:11.004 Name: ctxint.runq          Units: runqSize              Val: 238
 07:32:11.005 Name: disktotals.reads     Units: reads/sec             Val: 0
 07:32:11.005 Name: disktotals.readkbs   Units: readkbs/sec           Val: 0
 07:32:11.005 Name: disktotals.writes    Units: writes/sec            Val: 0
 07:32:11.005 Name: disktotals.writekbs  Units: writekbs/sec          Val: 0
 collectl -scd --export gexpr,1.2.3.4:5,d=9,g

 05:43:19.003 Name: cpu_user             Units: percent      Val:        0 TTL: 5 sent
 05:43:19.004 Name: cpu_nice             Units: percent      Val:        0 TTL: 5 sent
 05:43:19.004 Name: cpu_system           Units: percent      Val:        1 TTL: 5 sent
 05:43:19.004 Name: cpu_wio              Units: percent      Val:        0 TTL: 5 sent
 05:43:19.004 Name: cpu_idle             Units: percent      Val:       99 TTL: 5 sent
 05:43:19.004 Name: cpu_aidle            Units: percent      Val:       99 TTL: 5 sent
 05:43:19.005 Name: cpu_num              Units: CPUs         Val:        1 TTL: 5 sent
 05:43:19.005 Name: proc_total           Units: Load/Procs   Val:      141 TTL: 5 sent
 05:43:19.005 Name: proc_run             Units: Load/Procs   Val:        0 TTL: 5 sent
 05:43:19.005 Name: load_one             Units: Load/Procs   Val:        0 TTL: 5 sent
 05:43:19.005 Name: load_five            Units: Load/Procs   Val:        0 TTL: 5 sent
 05:43:19.006 Name: load_fifteen         Units: Load/Procs   Val:        0 TTL: 5 sent
This is an example of what you should expect to see, noting that in this case gmond is still configured to collect its standard metrics, which can be disabled in gmond.conf since you no longer need these.
 gmond -d 2
 loaded module: core_metrics
 loaded module: cpu_module
 loaded module: disk_module
 loaded module: load_module
 loaded module: mem_module
 loaded module: net_module
 loaded module: proc_module
 loaded module: sys_module
 udp_recv_channel mcast_join=NULL mcast_if=NULL port=8108 bind=NULL
 tcp_accept_channel bind=NULL port=8109
 Processing a metric metadata message from cag-dl585-02.cag
 ***Allocating metadata packet for host--cag-dl585-02.cag-- and metric --cputotals.user-- ****
 saving metadata for metric: cputotals.user host: cag-dl585-02.cag
 Processing a metric value message from cag-dl585-02.cag
 ***Allocating value packet for host--cag-dl585-02.cag-- and metric --cputotals.user-- ****
 saving metadata for metric: cputotals.nice host: cag-dl585-02.cag
| updated Feb 21, 2011 |